The Sphingidae of Southeast-Asia
(incl. New Guinea, Bismarck & Solomon Islands) Back to start page
by Jan Beck & Ian J. Kitching
Patterns of diversity and distribution
(based on data in version 0.99 - what's new in version 1.6?)
The Malay Archipelago has been an area of intense biogeographical analysis since A. R. Wallace realised the influence of geological history on the distribution of animal and plant species (for recent examples, see e.g. Holloway 2003, Hall & Holloway 1998). Lowered water levels during long periods of the Pleistocene (see Voris 2000), for example, may be responsible for the faunal similarity of the islands on the Sunda Shelf ('Sundaland'), both among themselves and with the mainland, while narrow but deep straits cut them off from the regions to the east and created faunal and floral discontinuities such as 'Wallace’s Line'. The compound geological history of islands such as Sulawesi explains the restriction of some species of slowly dispersing taxa to particular island parts, whereas for better dispersing groups (e.g. birds, butterflies) clusters of islands with similar faunas could repeatedly be found (see Withmore 1987 for an overview).
Here we present some analyses of the distribution of sphingids from Peninsular Malaysia to the Solomon Islands, under the major headings of a) species richness across the archipelago, b) biogeographical patterns, and c) endemism.
A) Species Richness
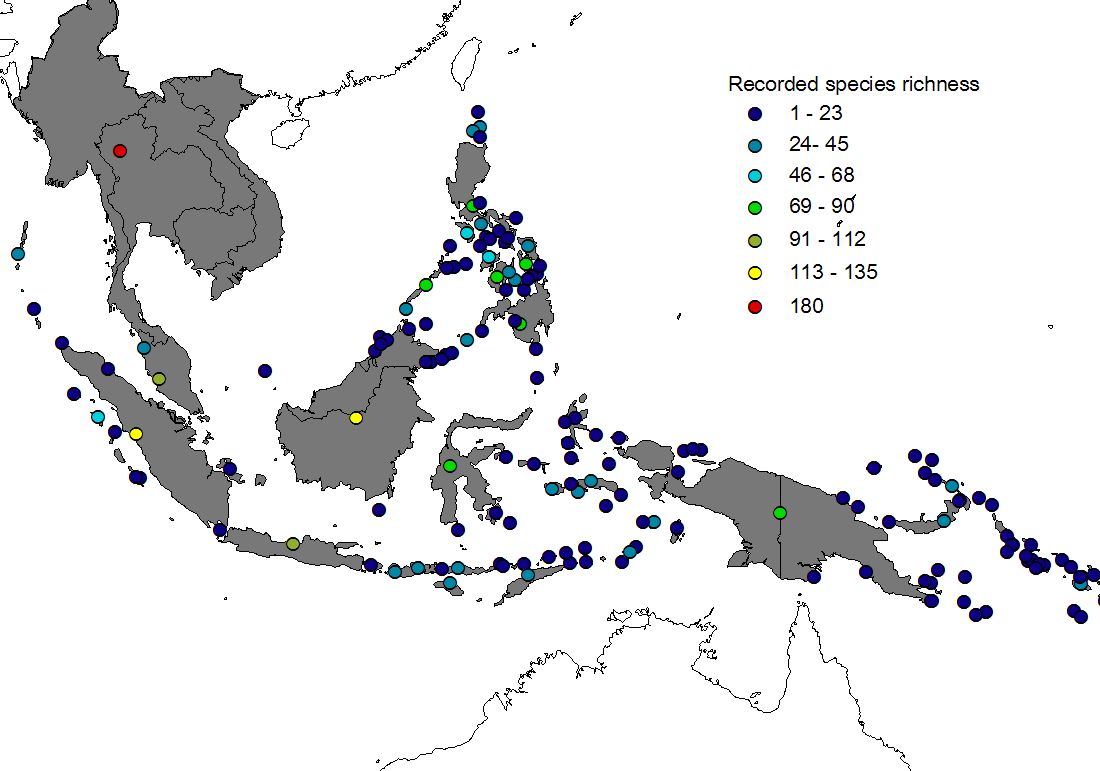
Figure 1 shows recorded (upper) and estimated (lower) species richness of 113 islands (+ Peninsular Malaysia & Thailand). Three features of the Southeast-Asian sphingid fauna are evident:
1) Large islands hold more species than small islands (the well-known species-area relationship, see e.g. Rosenzweig 1995).
2) Species richness decreases from the (continental) west towards the east (a statistically significant correlation between longitude and species richness was found for estimated data, though not for recorded data).
3) A comparison of recorded and estimated data documents massive under-sampling, particularly of smaller islands, even though Sphingidae are probably the second-best documented insect taxon (next to butterflies) in tropical Asia.
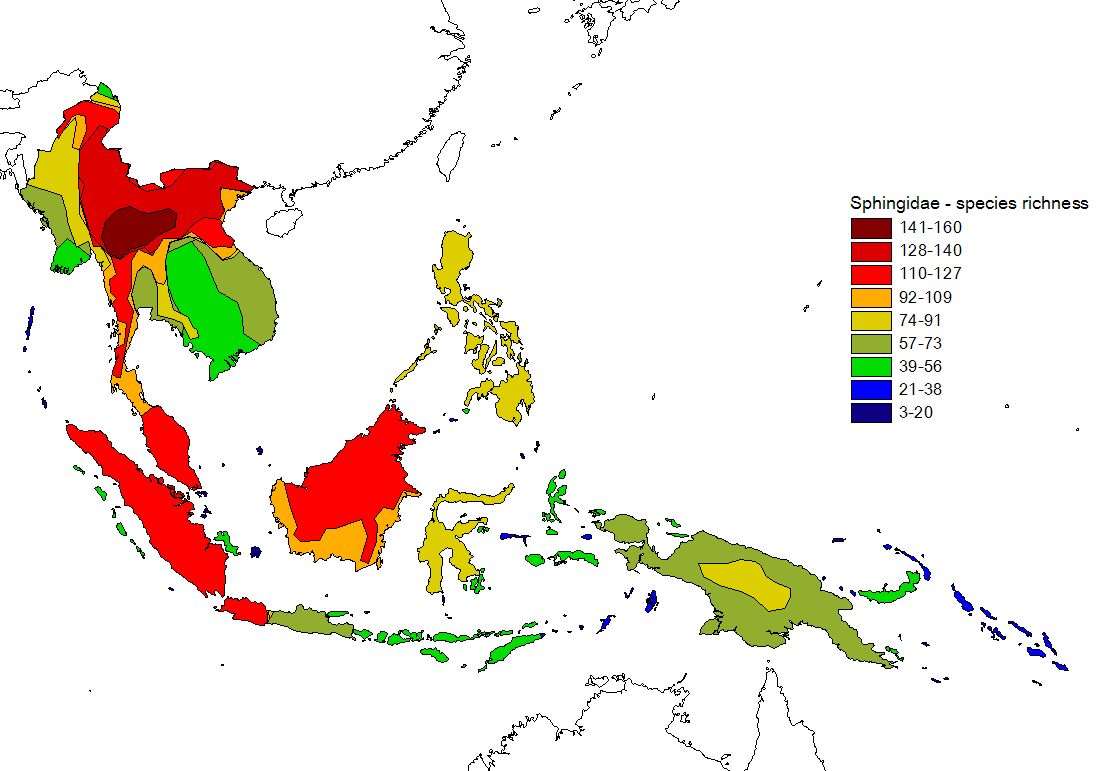
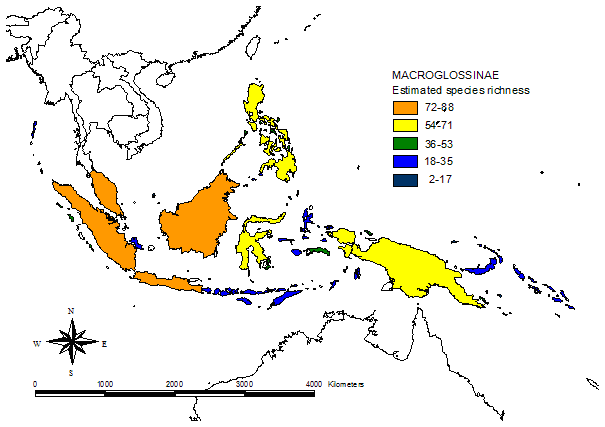
Figure 1) Recorded (upper) and estimated (lower) species richness in islands of the Malay Archipelago. For a description of the process of range estimation click here. Maps pf estimated species richness are also available for separately for subfamilies Macroglossinae and Smerinthinae, and for restricted and widespread species. Black-and-white versions of these maps have been published in our J. Biogeogr. article, where you can find details on methods and interpretation (see publications).
In addition to this eastwards decline in species richness, there is a parallel change in the relative contributions of different taxonomic subgroups of Sphingidae to island faunas (see figure 2, click here for maps of subfamilies). Most notably, the subfamily Smerinthinae declines dramatically the further east from continental Asia one travels (there are no Smerinthinae recorded from Pacific islands east of the Solomons), and Macroglossinae become more dominant, whereas Sphinginae do not show any evident trend.
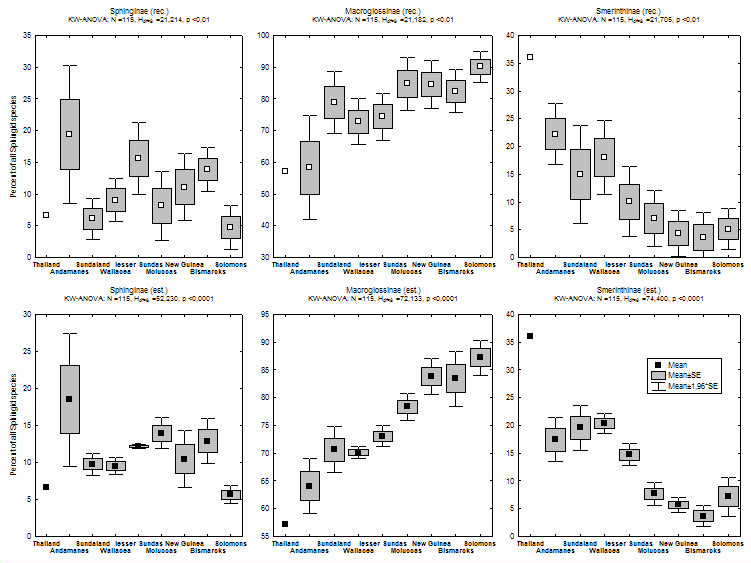
Figure 2) Percent contribution of Sphingid subfamilies to island faunas (for recorded data: upper graphs, estimate data: lower graphs). Islands are grouped according to biogeographic affiliation (sensu Holloway 1987, for butterflies) and sorted by longitude in the graphs. Direct correlations of the longitude of 113 islands & Peninsular Malaysia with relative subfamily contribution are highly significant for Macroglossinae (positive) and Smerinthinae (negative) [rec. & est. data].
Most Smerinthinae share a (plesiomorphic) life-history including a short, non-feeding adult phase. Females produce all their eggs from larval-obtained resources and can often be recognized by their large, heavy abdomens. In contrast, Sphinginae and Macroglossinae feed as adults and often show little sexual dimorphism (see Kitching & Cadiou 2000). It is tempting to assume that the above mentioned distribution patterns are linked to these life-history differences: Smerinthinae seem to be more bound to stable, primary habitat, which might make them less successful in reaching or establishing themselves on new islands. Many Macroglossinae, on the other hand, seem to prefer disturbed habitats, which (at least before the time of modern anthropogenic habitat disturbance) are ephemeral and have to be colonized by continuous dispersal (Beck et al., in prep.).
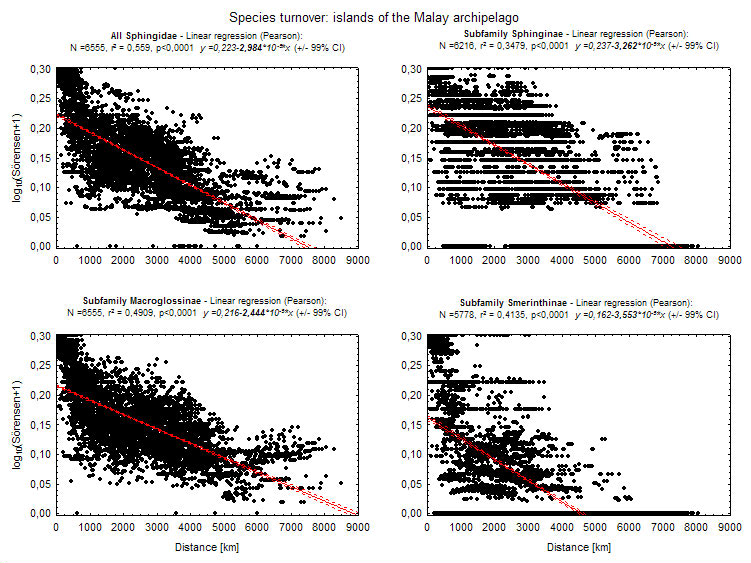
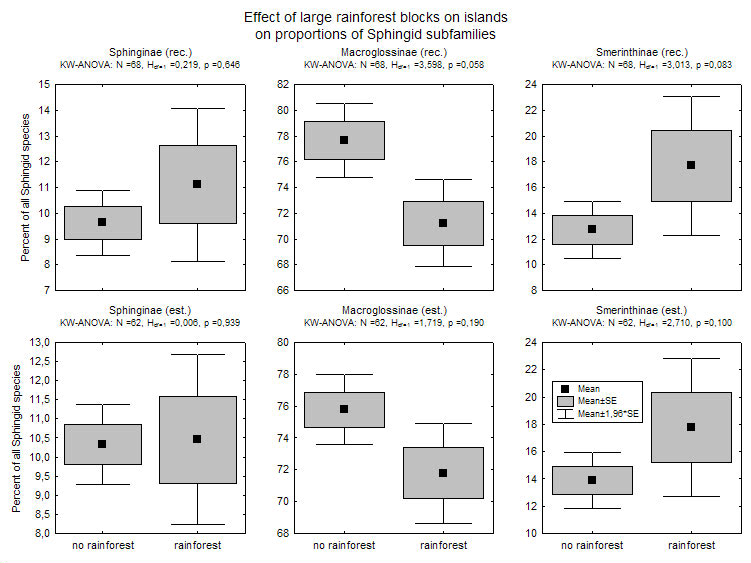
Several factors might therefore cause or interact to create the 'replacement' of Smerinthinae by Macroglossinae: a) most colonization most probably originated from continental tropical Asia - increasing distance of islands from this source makes them less likely to be reached by poor colonizers (species turnover of island faunas in relation to the distance between islands is significantly steeper for Smerinthinae than for other subfamilies, see graph); b) there is a trend for Smerinthinae to be more species-rich on islands with large rainforest blocks, while the reverse is true for Macroglossinae (see graph; data in islands mostly from Monk et al. 1997). Rainforested islands become less common towards the east, both because island size gets smaller (except New Guinea) and because islands in the southeast are drier and more seasonal (Monk et al. 1997).
B) Patterns of Biogeography
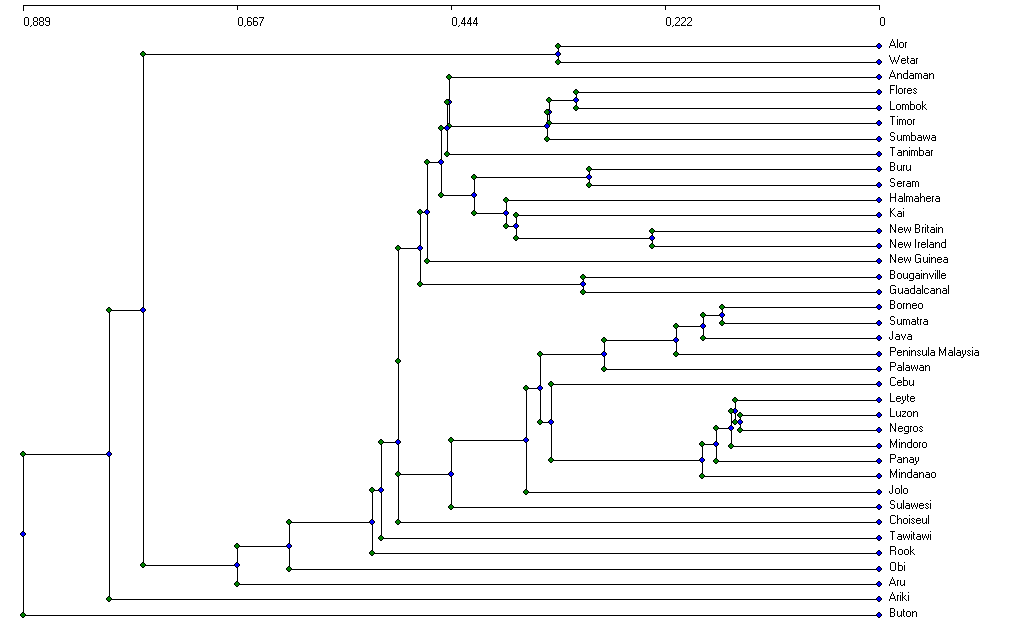
For the analysis of biogeographical patterns we used estimated data on island faunas, which yielded clear and readily interpretable results. As a first step of analysis, nested island faunas (faunas which are completely contained in some other (typically nearby and larger) island were identified and excluded from analysis, as they disturb the clustering and ordination processes (see e.g. Holloway 2003). Of the 114 islands (113 + Peninsular Malaysia) for which data were available, 38 'genuine' island faunas remained for further analyses (see fig. 3 for details).
Recorded data, on the other hand, did not perform as well (presumably due to the effects of undersampled faunas on all but the largest islands of the archipelago, see fig. 1), although some lower-order clustering is similar to that found for the estimated data (see graph based on recorded data: single linkage cluster analysis, Bray-Curtis distances).
Figure 3 shows a cluster dendrogram of estimated data based on Preston-coefficients. Derived from species-area relationship principles, this 'coefficient of faunal resemblance' (Preston 1962) has interesting properties for biogeographical analysis: If z , which measures the relative faunal distance between two samples from 0 to 1, is below the equilibrium value of 0.27, the samples can be considered to come from the same region (i.e., there is faunal exchange). If, on the other hand, z >0.27, then "there is, and has long been, some degree of genuine isolation" (Preston 1962).
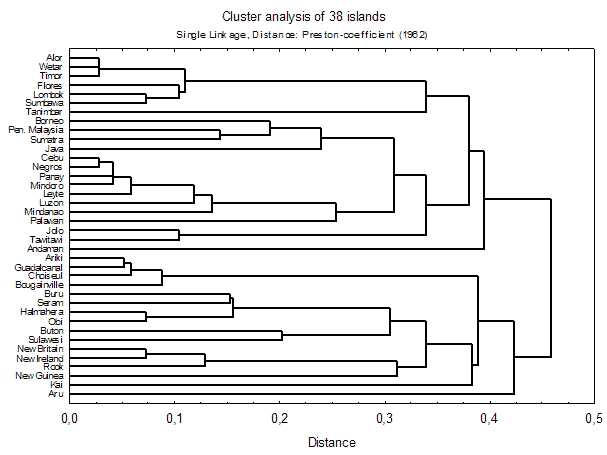
Figure 3: Cluster analysis of Preston-coefficients of estimated island faunas. Nested island faunas were excluded from analysis and are defined in the Box below. Click here for a linkage diagram (fitted on a map of SE-Asia) for better understanding of the relationships. A table of z-values is available.
Nested island faunas in:
Andaman: Nicobar Ariki: Kolombangara, New Georgia, Rendova, Vella Lavella Borneo: Natuna Bougainville: Alu Flores: Adonara, Lembata ('Solor archipelago') Guadalcanal: Florida, Isabel, Makira, Malaita, Rennel, San Jorge, Santa Cruz Halmahera: Bacan, Gebi Java: Bali Leyte: Dinagat, Homohon, Panaon, Taytay, Samar Luzon: Burias, Camiguin de Luzon, Catanduanes, Marinduque, Masbate, Polillo, Ticao Mindanao: Basilan, Camiguin de Mindanao, Calayan Mindoro: Sibuyan Negros: Bohol, Siquijor New Guinea: Biak, Dampier, Ferguson, Goodenough, Mefor, Misol, Rossel, St. Aignan, Sudest, Trobriand, Woodlark, Waigeo New Ireland: Dyaul, Lavongai, Manus, Mussau Palawan: Balabac, Calamian, Dumaran Seram: Ambon, Kelang Sulawesi: Sangir, Selayer, Sula Sumatra: Banka, Sabang, Nias, Simeuloe, Pagai-Pagai, Pini, Mentawi Sumbawa: Sumba, Komodo Tanimbar: Yamdena, Selaru. Larat ('Tanimbar islands') Timor: Damar, Leti, Roma, Sermatta ('Bandar Daya islands').
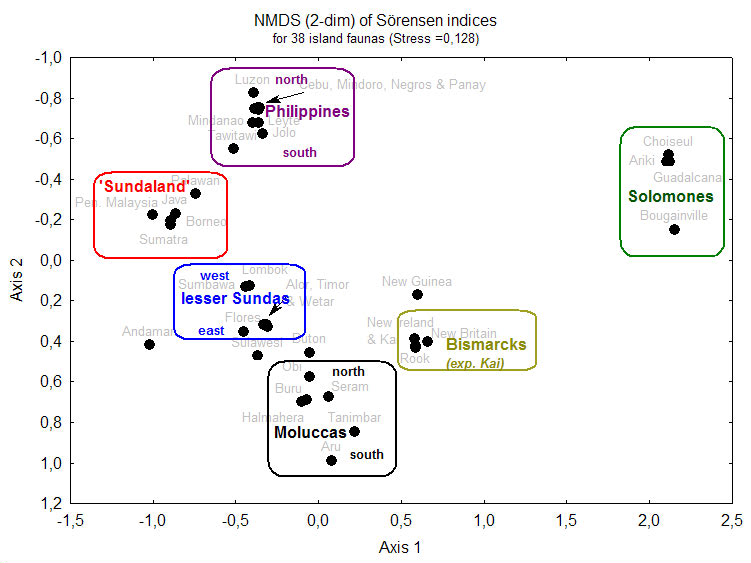
As the results of clustering and ordination techniques are often heavily dependent on the method employed, several different approaches were used. Click the links for a cluster analysis based on Bray-Curtis coefficients or a nonmetric Multi-Dimensional Scaling of Sørensen-indices (distance of dots indicates faunal similarity).
Several well-established patterns of SE-Asian biogeography are reiterated in these ordinations. 'Wallace’s Line' between Borneo and Sulawesi is a major faunal discontinuity. The Lesser Sunda Islands ('Nusa Tenggara') form their own, intermediate, faunal region, but fall themselves into a western and an eastern part. The islands of Bismarck Archipelago have a fauna that is quite distinct from nearby New Guinea, and this is even more evident for the Solomon Islands. The Greater Sunda Islands (Borneo, Sumatra, Java) and Peninsular Malaysia form a tight cluster (with greatest similarity between Peninsular Malaysia and Sumatra), although Java is slightly more distinct, which is well explained by the effect of different sea levels (see Voris 2000).
However, some expected patterns are not found: the Philippines and Sulawesi do not form a faunal group, 'Wallacea', as has been found in other Lepidoptera (e.g. Holloway 1987). This is probably due to the high number of Sulawesi endemics (see below). The same effect is probably responsible for the separation of New Guinea from neighbouring islands. Palawan, classically considered as part of the 'Sundaland'-group, seems to have a transitional fauna between Sundaland and the Philippines (grouped with the latter in Preston-analysis [above], with the former in Bray-Curtis analysis; see also MDS and linkage diagrams 1, 2). The Andamans and Nicobars are very difficult to classify - certainly they are not as close to Sumatra as their geological position on the Sunda-arc might suggest.
Analyses on subfamily-level repeat many patterns that were found at the family-level. However, whereas Wallace’s Line is a major faunal disjunction for Macroglossinae (as for Sphingidae as a whole), 'Lydekker's line' (Monk et al 1997, p312) between the Moluccas and New Guinea seems more influential as a biogeographical boundary for Smerinthinae. Sphinginae have their greatest faunal turnover between New Guinea and the Solomons.
In addition to classifying islands by their sphingid fauna, hawkmoth species can also be classified according to their distribution patterns (r-mode analysis). While no higher-order classification could be reached here, certain species groups with similar degrees of endemism to islands or island groups can be identified.
C) Endemism
The table below lists the number and proportion of endemic species in major regions of the Malay Archipelago (bold print) and on selected smaller regions or single islands (in italics). All major regions have a relatively high percentage of endemics (7-27%), which justifies their separation as faunal regions. However, at higher geographical resolution great differences in endemism can be found.
All the Sundaland islands show a very low degree of endemism, which again mirrors the effect of a long continental connection during the Pleistocene (e.g. Voris 2000). While Wallacea as a whole has a fair degree of endemism, this is mostly due to Sulawesi, where more than one in five species is an endemic. This is exceeded only by New Guinea where more than a quarter of species are found exclusively on this large and geographically extremely diverse island.
The North Moluccas as a whole have >10% endemic species, while of the isolated South Moluccan islands only Tanimbar has a similar proportion. From Kai and Aru, on the other hand, no endemic species are known. Possibly these islands are so isolated that only the very best dispersers reached them, which then can keep contact with surrounding populations regularly enough to prevent speciation. Alternatively, these two island groups are badly undersampled and might house a number of endemic species that are yet to be discovered.
| Region | Endemics*) | Species (total) | % Endemics |
| Andamans | 1 | 36 | 2,8 |
| Sundaland**) | 34 | 164 | 20,7 |
| Borneo | 2 | 113 | 1,8 |
| Java | 0 | 109 | 0,0 |
| Palawan | 0 | 89 | 0,0 |
| Sumatra | 2 | 127 | 1,6 |
| Lesser Sundas | 6 | 55 | 10,9 |
| Western Less. Sund (NTB) | 2 | 51 | 3,9 |
| Easter Less. Sund. (NTT) | 3 | 49 | 6,1 |
| Wallacea | 23 | 140 | 16,4 |
| Luzon | 1 | 87 | 1,1 |
| Mindanao | 2 | 82 | 2,4 |
| Sulawesi | 19 | 84 | 22,6 |
| Sulu Islands | 1 | 39 | 2,6 |
| Moluccas | 12 | 79 | 15,2 |
| north | 7 | 59 | 11,9 |
| Kai | 0 | 26 | 0,0 |
| Aru | 0 | 21 | 0,0 |
| Tanimbar | 4 | 37 | 10,8 |
| New Guinea | 21 | 78 | 26,9 |
| Bismarck islands | 6 | 43 | 14,0 |
| New Britain | 1 | 41 | 2,4 |
| New Ireland | 1 | 38 | 2,6 |
| Solomon islands | 2 | 28 | 7,1 |
| Bougainville | 1 | 32 | 3,1 |
| Guadalcanal | 1 | 32 | 3,1 |
*) Includes nested island faunas
**) Sundaland "endemics" refers to species that are not found in other parts of the Archipelago.
However, many also occur on continental SE-Asia.